
INVESTATREND
InvestaTrend is a powerful and intuitive analysis tool that allows you to model and compare the historical performance of hundreds of investments, including stocks, ETFs, and more. With InvestaTrend, you can rank stocks and ETFs against each other over any time period, evaluate key metrics like growth and volatility, and easily identify the strongest long-term performers at scale.
About
Metrics make it easy to compare hundreds of investments at scale
Our Purpose
is to equip individuals with the tools to build financial independence—so they can live freely and shape their future on their own terms.
Insight. Independence. Investment—Made Simple.
Unlike traditional tools that drown you in raw numbers, InvestaTrend distills decades of price history into two simple, powerful metrics: growth and volatility. Backed by machine learning, these metrics let you compare hundreds of investments at scale, uncovering consistent performers and revealing hidden risks.
These metrics allow you to:
- Compare hundreds of investments side-by-side with clear rankings
- Visualize performance over different time horizons
- Filter, sort and rank investments by growth, volatility, market cap, or custom criteria
- Access intuitive charts that display both price trends and standardized fluctuations
Fundamental Principles
Steps
Get started in three steps: download InvestaTrend, import your data, and run your analysis.

Download Investatrend
Go to
ezcalc.net/downloads
,
select the version compatible with your system, click download and save the installer or zip file to your computer.
Double-click the installer and follow the prompts to install InvestaTrend.

Get Financial Data
You can get end-of-day stock data from many sources online. One recommended option is the Starter Plan available at
- https://site.financialmodelingprep.com/
- Get "End of Day" data
- Download the data as a CSV file(s)
We include a convenient FMP_Data_Downloader.exe downloader if you want something faster (includes source code). Please note that you will require an API key to use this tool.
We also provide tutorials to help you through the process—so you’re never stuck.

Set Up For Analysis
Load your stock data to InvestaTrend via the “Import Price CSV Data” tab, set your calculation preferences, and hit Calculate.

Get Started with InvestaTrend
Compare, rank, and visualize performance to make informed long-term decisions.
Download InvestaTrend NowFeatures
Designed to help users make informed, data-driven investment decisions
Integrated Business Framework
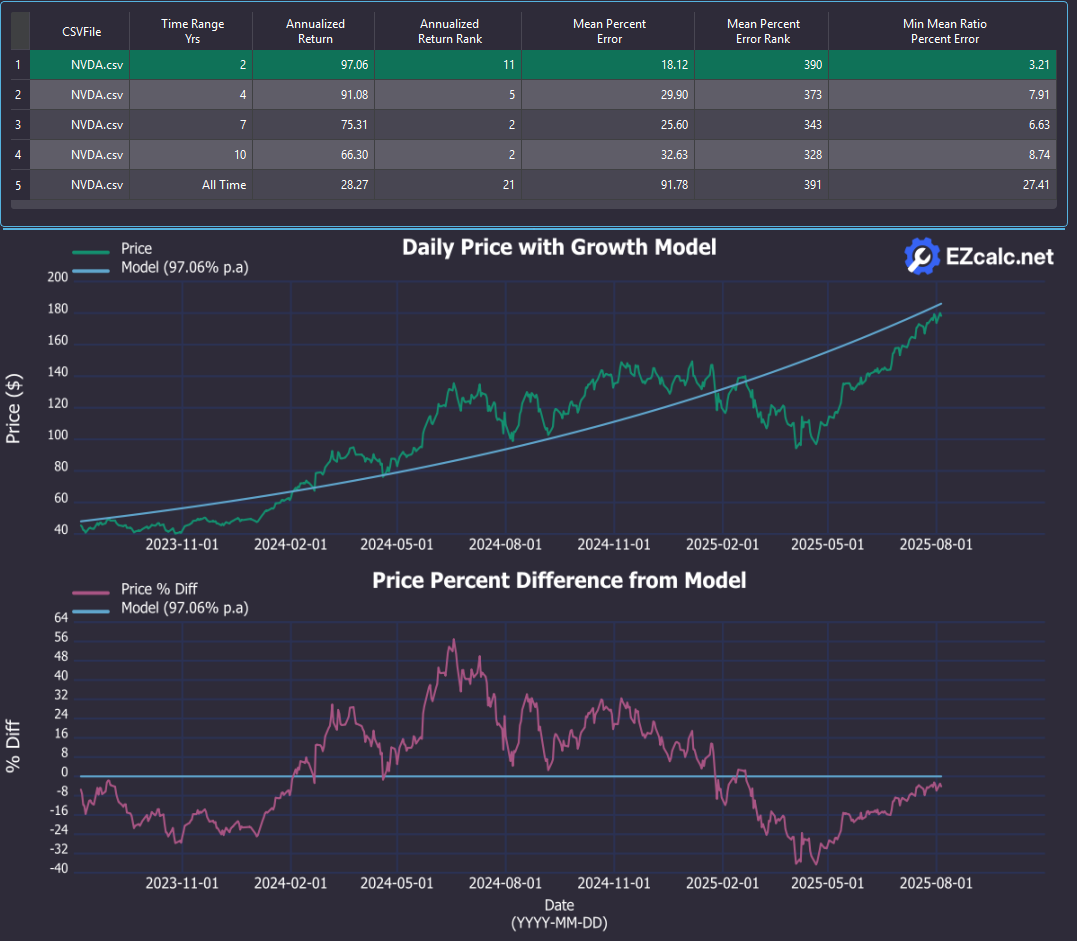
InvestaTrend is a powerful, user-friendly tool designed to analyze historical stock performance and help users make informed long-term investment decisions. It uses machine learning to model stock prices with a compound interest curve, generating two key metrics:
Growth: The year-on-year compounded growth rate of a stock. Volatility: Measured as "mean percent error," which quantifies price fluctuations around the modeled trend.
Gain actionable insights through sophisticated analytics and reporting tools, empowering informed decision-making at every turn.
Machine Learning Models
Use machine learning to create best-fit compound interest curves for stock price data.
Customizable Time Periods
Analyze stock performance over any time period or all-time.
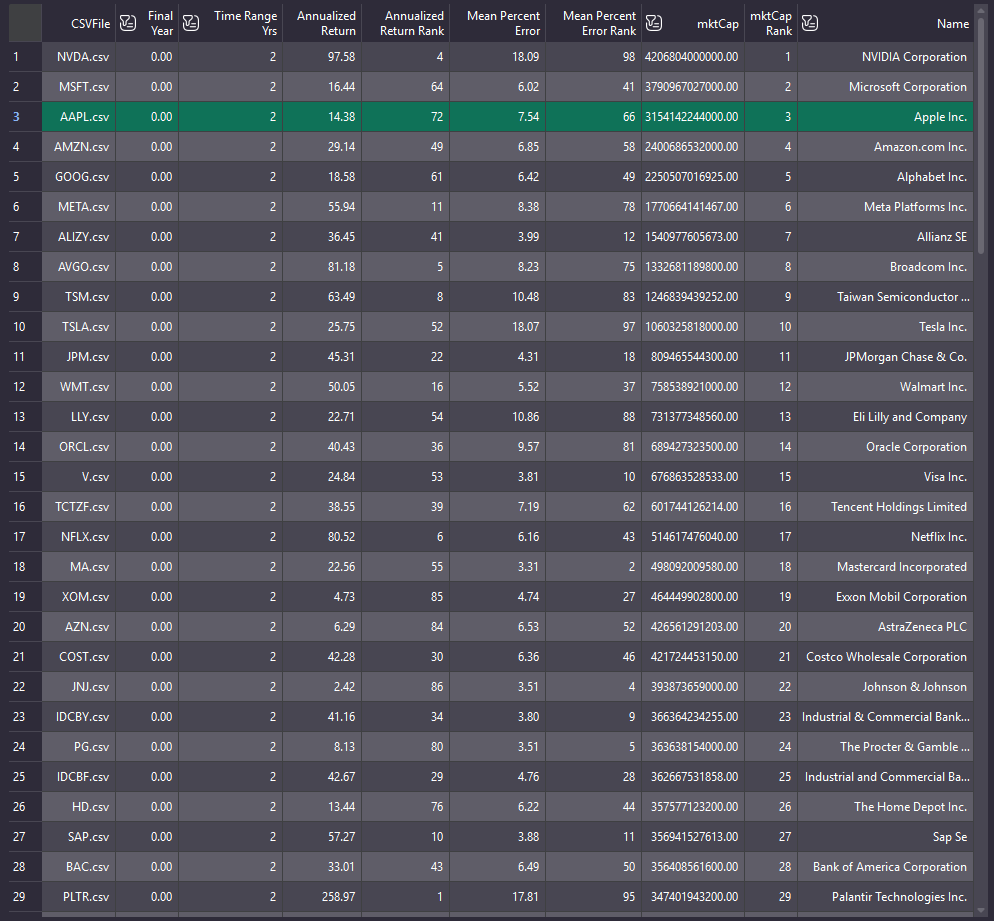
Stock Rankings
Rank stocks by growth, volatility, market cap, or other key metrics for easy comparison across any time period.
Educational Resources
Check out tutorials on using InvestaTrend on our YouTube channel, The Easy Calc Toolbox, and learn key features and strategies for smarter investing.
Scalable Comparison
Compare a multitude of stocks at scale to identify consistent top performers.
User-Friendly Interface
Sort and filter stocks by metrics and rankings in an intuitive table.
Visualize Growth
Visualize stock prices with machine learning models and fluctuations.
Pricing
Free
- Analyze up to 2 years of historical stock data.
- View growth and volatility metrics for selected stocks.
- Sort and rank stocks by key metrics (growth, volatility, etc.)
- Backtesting: Analyze investment performance up to 2 years in the past.
Buy Pro
- Analyze unlimited years of historical stock data.
- View growth and volatility metrics for selected stocks.
- Sort and rank stocks by key metrics (growth, volatility, etc.)
- Backtesting: Analyze investment performance as if it were any year in the past.
- Analyze the all-time performance of any stock.